1. Understanding Optical Power Budgets
Every fiber optic link has a power budget — the difference between how much light the transmitter puts out and the minimum amount the receiver needs to work reliably. If the total loss in the cable plant exceeds the power budget, you get low light.
1.1 Key Terms
| Term | What It Means | Typical Values |
|---|---|---|
| LL Threshold — GPON | Minimum acceptable receive power at the NIU (1490 nm, VeEX) | -22.0 dBm |
| LL Threshold — XGS-PON | Minimum acceptable receive power at the NIU (1577 nm, VeEX) | -22.0 dBm |
| LL Threshold — Go-Long | Minimum acceptable receive power at the NIU (1550 nm, OPM) | -28.0 dBm |
| Fiber Loss | Attenuation per km of singlemode fiber (varies by wavelength) | 0.22 dB/km (1550 nm), 0.30 dB/km (1490/1577 nm), 0.35 dB/km (1310 nm) |
| Splice Loss | Target per individual fusion splice (splicer screen) | ≤ 0.02 dB target, < 0.1 dB bi-directional mean |
| Connector Loss | Max insertion loss per mated connector pair | ≤ 0.5 dB |
| Loss Budget | Total calculated loss (fiber + splices + connectors + splitters) must stay below threshold | Must keep NIU reading above LL threshold |
1.2 How to Calculate a Loss Budget
Add up every source of loss in the link:
Total Loss = Fiber Loss + Splice Loss + Connector Loss + Splitter Loss
Fiber: 0.35 dB/km × distance (singlemode @ 1310nm)
0.22 dB/km × distance (singlemode @ 1550nm)
Splices: 0.1 dB per fusion splice (max)
Connectors: 0.5 dB per mated pair (max)
Splitter: Depends on split ratio:
1:2 = 3.5 dB, 1:4 = 7 dB, 1:8 = 10.5 dB
1:16 = 14 dB, 1:32 = 17.5 dB, 1:64 = 21 dB
1.3 Example Calculation
Scenario: GPON link, 10 km, 1:32 split, 4 splices, 2 connector pairs
Fiber loss: 10 km × 0.35 dB/km = 3.5 dB
Splice loss: 4 × 0.1 dB = 0.4 dB
Connector loss: 2 × 0.5 dB = 1.0 dB
Splitter loss: 1:32 = 17.5 dB
Total Loss Budget = 3.5 + 0.4 + 1.0 + 17.5 = 22.4 dB
If power budget is 28 dB → margin = 28 − 22.4 = 5.6 dB ✓ Good
If power budget is 23 dB → margin = 23 − 22.4 = 0.6 dB ⚠ Tight — any additional loss will cause low light
1.4 Low Light Thresholds
LL thresholds are a universal standard that applies across all ticket types — Reactive, MW, and Planned. We maintain them in a dedicated reference page.
Field Standards Reference
LL thresholds (GPON / XGS-PON / Go-Long), splice standards, connector criteria, fiber attenuation, splitter loss, and path format reference.
2. OTDR Trace Analysis — Reading Events
The OTDR is your most powerful diagnostic tool. Understanding what each event on a trace means is essential for low-light troubleshooting.
2.1 OTDR Setup for Diagnostics
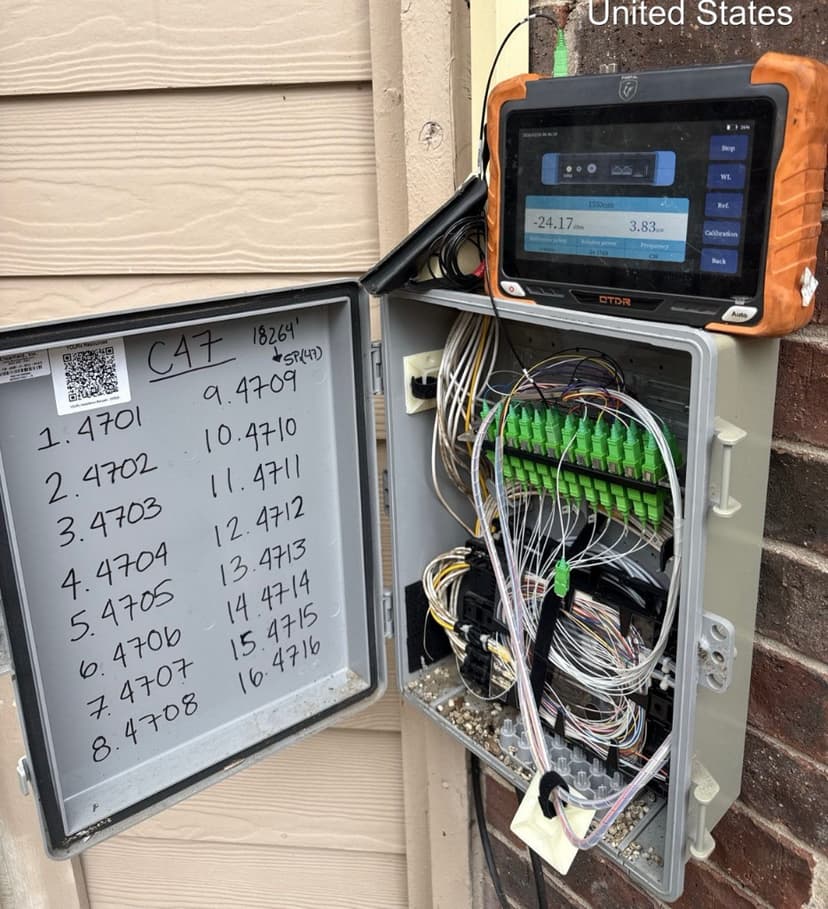
VeEX OTDR at NDP — measuring power and running trace
- Attach a launch cable (≥330 ft singlemode, ≥100 ft multimode) to move the dead zone past the first connector.
- Attach a receive cable at the far end to properly characterize the last connector.
- Set wavelength to match the operating wavelength of the link (usually 1310nm or 1550nm).
- Set pulse width: shorter pulse = better resolution but less range. Start with auto, then adjust.
- Set range to approximately 2× the expected cable length.
- Run a trace. For best accuracy, use averaging (30–60 seconds).
2.2 Interpreting Events on the Trace
Fusion Splice
Appearance
Small downward step in the trace (loss event), no reflective spike
Expected Value
≤ 0.1 dB loss
Low-Light Implication
If > 0.1 dB → bad splice, needs re-splicing
Mechanical Splice (legacy)
Appearance
Downward step with small reflective spike
Expected Value
≤ 0.3 dB loss, some reflectance
Low-Light Implication
Not used in modern networks. If found on legacy plant, replace with fusion splice.
Connector (UPC)
Appearance
Downward step with significant reflective spike
Expected Value
≤ 0.5 dB loss per mated pair, reflectance ≤ -40 dB
Low-Light Implication
High loss → dirty or damaged. High reflectance → cracked ferrule or air gap.
Connector (APC)
Appearance
Downward step, minimal or no reflective spike
Expected Value
≤ 0.5 dB loss, reflectance ≤ -60 dB
Low-Light Implication
If reflective spike appears → wrong connector type mated (APC to UPC — never do this).
Macro-Bend
Appearance
Gradual localized loss increase, no reflection. Often more visible at 1550nm than 1310nm.
Expected Value
Should not exist
Low-Light Implication
Cable is bent below minimum radius. Find and fix the routing.
Break / End of Fiber
Appearance
Reflective spike followed by noise floor (signal drops to nothing)
Expected Value
Should only appear at the actual end of the fiber
Low-Light Implication
If it appears mid-link → the fiber is broken at that point.
Ghost
Appearance
Apparent event that repeats at regular intervals — not a real event
Expected Value
Caused by high reflectance bouncing inside the fiber
Low-Light Implication
Ignore ghosts. Fix the high-reflectance connector causing them.
2.3 Bi-Directional Testing
OTDR measurements from one direction can be misleading due to mode field diameter differences at splice points (especially when splicing different fiber manufacturers). A splice may appear as a gain from one direction and a loss from the other.
Best practice: Always test from both ends and average the two measurements for each event. This gives you the true loss value.
3. Common Causes of Low Light
Ranked by frequency in the field — check these first:
Dirty Connectors
The #1 cause of low light. A single speck of dust on a connector end-face can cause 1+ dB of loss. Always clean and inspect before declaring a fault.
Fix: Clean with one-click cleaner or IPA wipe. Re-test light levels. Repeat until clean.
Bad or Degraded Splice
Fusion splices can degrade over time due to moisture ingress, mechanical stress, or poor initial splice quality.
Fix: OTDR to identify high-loss splice. Open enclosure, cut out old splice, re-splice. Target ≤ 0.02 dB.
Macro-Bend
Fiber bent below its minimum bend radius. Common at patch panels, cable entry points, and where cable is pinched by hardware. More visible at 1550nm.
Fix: Trace the cable route physically. Fix any sharp bends. Use proper bend-radius-limited hardware.
Damaged Connector Ferrule
Scratched, chipped, or cracked ferrule. Can happen from repeated mating, dropping, or using wrong cleaning tools.
Fix: Replace the patchcord or re-terminate the connector. Do not attempt to polish a cracked ferrule.
Wrong Connector Type Mated
APC (green) mated to UPC (blue) causes very high loss and reflectance. The angled end-face doesn't make proper contact with a flat end-face.
Fix: Never mix APC and UPC. Replace with matching connector types.
Water / Moisture Ingress
Water in a splice closure or cable sheath causes micro-bending and increased attenuation, especially in cold weather (ice expansion).
Fix: Open affected enclosure, dry and re-seal. Check cable sheath integrity. Replace damaged sections.
Excessive Splitter Loss
Splitter operating above spec, or wrong split ratio installed. A 1:32 splitter accounts for 17.5 dB — leaves little margin on a long link.
Fix: Verify splitter ratio matches design. Test splitter ports individually. Replace if out of spec.
4. Method of Procedure (MOP) for Diagnostics
A MOP is a formal, step-by-step procedure that ensures consistent and thorough work. For low-light troubleshooting, follow this MOP from start to finish.
Low Light Diagnostic MOP
Follow steps in order. Do not skip.
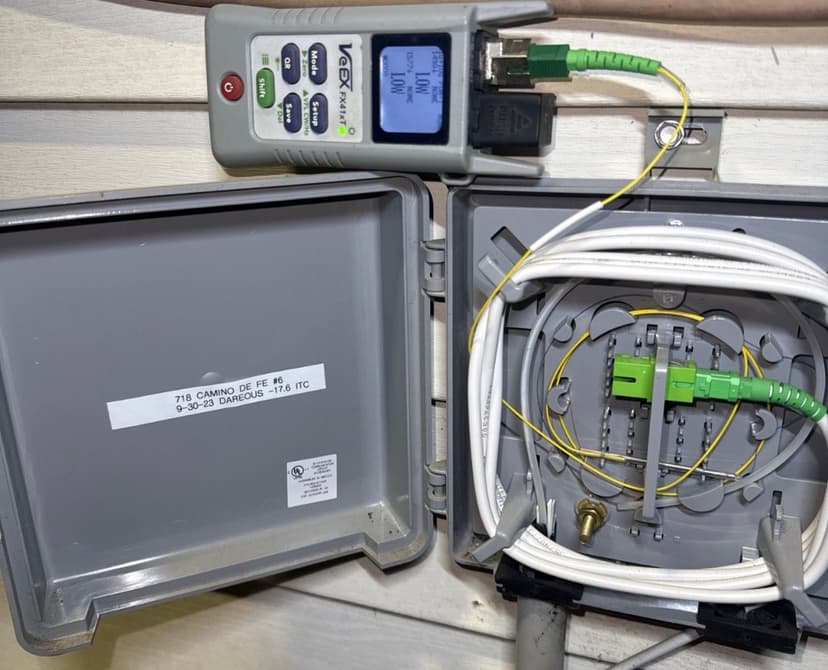
VeEX OPM — LOW reading at NIU
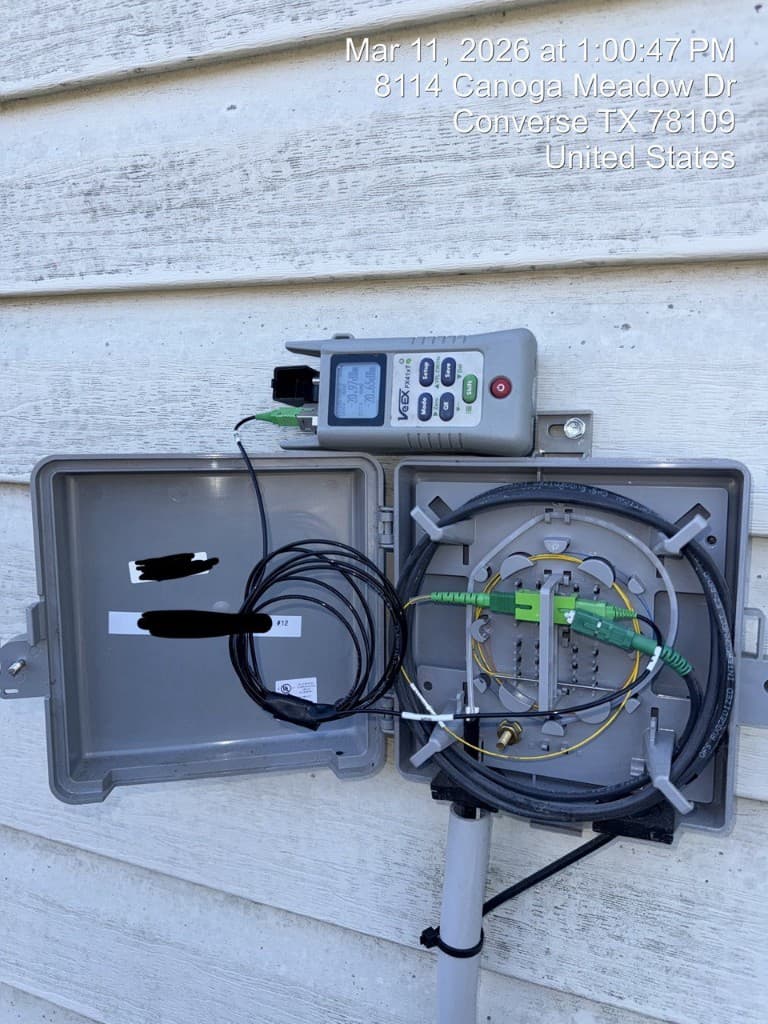
Normal power reading for comparison
MOP Step 1 — Gather Information
- 1Obtain the trouble ticket: customer location, service type, symptoms (total loss vs. intermittent).
- 2Pull the link's design documentation: expected loss budget, fiber route, splitter ratio, number of splices/connectors.
- 3Pull baseline test data (installation OTDR traces and power readings) if available.
- 4Determine the network tier: Is this an F4 drop issue, F3 distribution issue, or F2 feeder issue?
MOP Step 2 — Measure Current Power Levels
- 1At the NIU: measure receive power with VeEX or OPM. Record the value.
- 2Identify the technology type and compare to the LL threshold from the Field Standards page (GPON / XGS-PON / Go-Long).
- 3If within threshold → issue is NOT low light (escalate to NOC for equipment/config check).
- 4If below threshold → confirmed low light. Note the deficit (e.g., -25.0 dBm received on GPON = 3.0 dB below the -22.0 dBm threshold).
MOP Step 3 — Inspect and Clean All Connectors
- 1Start at the NIU: disconnect the fiber.
- 2Inspect the connector end-face visually for obvious damage.
- 3Clean with one-click cleaner. Re-inspect. Repeat until the end-face passes visual inspection.
- 4Clean the adapter/bulkhead as well.
- 5Re-connect and re-measure power at the NIU. If power is now within spec → dirty connector was the cause. Done.
- 6If still low → proceed to next step.
MOP Step 4 — VFL Trace from NIU
- 1Connect VFL at the NIU and trace outward toward the MST.
- 2Walk the accessible fiber route looking for VFL light escaping (indicates break, tight bend, or bad splice).
- 3Check all accessible enclosures, MST cans, and cable entry points.
- 4If VFL reveals the fault location → proceed to repair.
- 5If VFL does not reach the fault (too far) → proceed to OTDR.
MOP Step 5 — OTDR from Nearest Access Point
- 1Connect OTDR with launch cable at the nearest splice point or cabinet.
- 2Run a trace. Compare to baseline.
- 3Identify any new loss events, increased splice losses, or unexpected end-of-fiber.
- 4If a specific event is identified → localize it using distance + route maps.
- 5If trace looks clean → the issue may be at the splitter or transmitter. Test those individually.
MOP Step 6 — Isolate the Section
- 1Systematically test each section starting from the NIU outward: drop (F4), distribution (F3), feeder (F2).
- 2Measure loss across each section individually.
- 3Compare section loss to calculated budget for that section.
- 4The section with excess loss is where the problem is.
MOP Step 7 — Fix and Verify
- 1Execute the appropriate repair: clean connector, re-splice, fix bend, replace cable section.
- 2After repair: measure power at the NIU with VeEX. If within threshold → done. If not → OTDR again and find the next issue.
- 3Run OTDR on the repaired section. Save trace as the new baseline.
- 4Confirm with NOC that service is restored and alarms have cleared.
- 5Document everything: what you found, what you did, what the readings are now.
5. Connector Inspection & Cleaning
This section exists because dirty connectors cause more low-light tickets than all other causes combined. Master this skill and you will fix most low-light issues on the spot.
5.1 Inspection Procedure
- Visually check the connector ferrule for obvious damage (cracked, chipped, bent).
- If the ferrule looks physically intact, proceed to cleaning.
- If the ferrule is damaged, replace the patchcord or re-terminate.
5.2 Cleaning Methods
Dry Cleaning (One-Click Cleaner)
Best first attempt. Insert connector into the cleaner, press and release. One click = one clean surface. Re-inspect after cleaning. Use for: patch panels, patchcord ends, adapter-accessible connectors.
Wet-Dry Cleaning (IPA Wipe Method)
For stubborn contamination. Dampen a lint-free wipe with 99% isopropyl alcohol. Wipe the ferrule end-face in one direction (wet). Immediately follow with a dry wipe in one direction. Re-inspect. Use for: connectors with oily/sticky residue.
Adapter / Bulkhead Cleaning
Use a stick-type cleaner (2.5mm for SC/FC, 1.25mm for LC). Insert into the adapter, rotate ¼ turn, remove. The adapter is often dirtier than the connector and gets overlooked.
Never Do This:
- Never blow on a connector (moisture from breath contaminates)
- Never touch the ferrule end-face with fingers
- Never use compressed air without a filter (oil contamination)
- Never re-use a cleaning wipe or cassette slot
- Never skip inspection — clean blind, inspect after
6. Remediation & Verification
Once you've identified and fixed the cause of low light, verify the repair and update all records.
6.1 Post-Fix Verification Checklist
- 1Measure receive power at NIU with VeEX — must be above LL threshold (GPON: -22.0, XGS-PON: -22.0, Go-Long: -28.0 dBm)
- 2If not within threshold — OTDR again, find remaining issue, fix, re-test until NIU reads within spec
- 3OTDR trace on repaired section — save as new baseline
- 4Compare new OTDR trace to pre-repair trace — confirm improvement
- 5Confirm with NOC that service alarms have cleared
- 6Confirm with customer that service is working normally
- 7Update all test records in project documentation system
- 8If temporary fix — create follow-up ticket for permanent repair
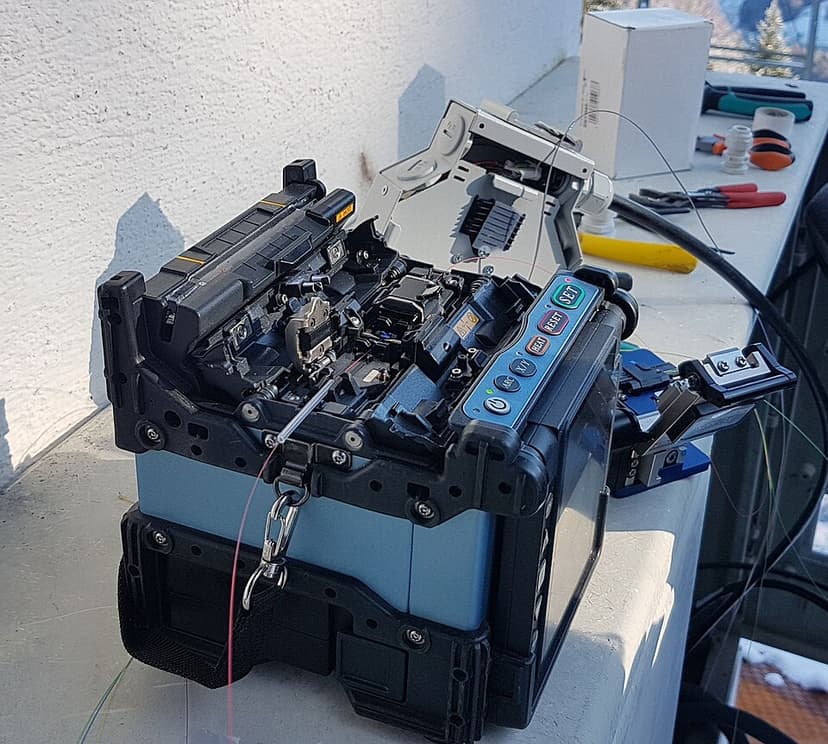
Re-splicing to fix high-loss event
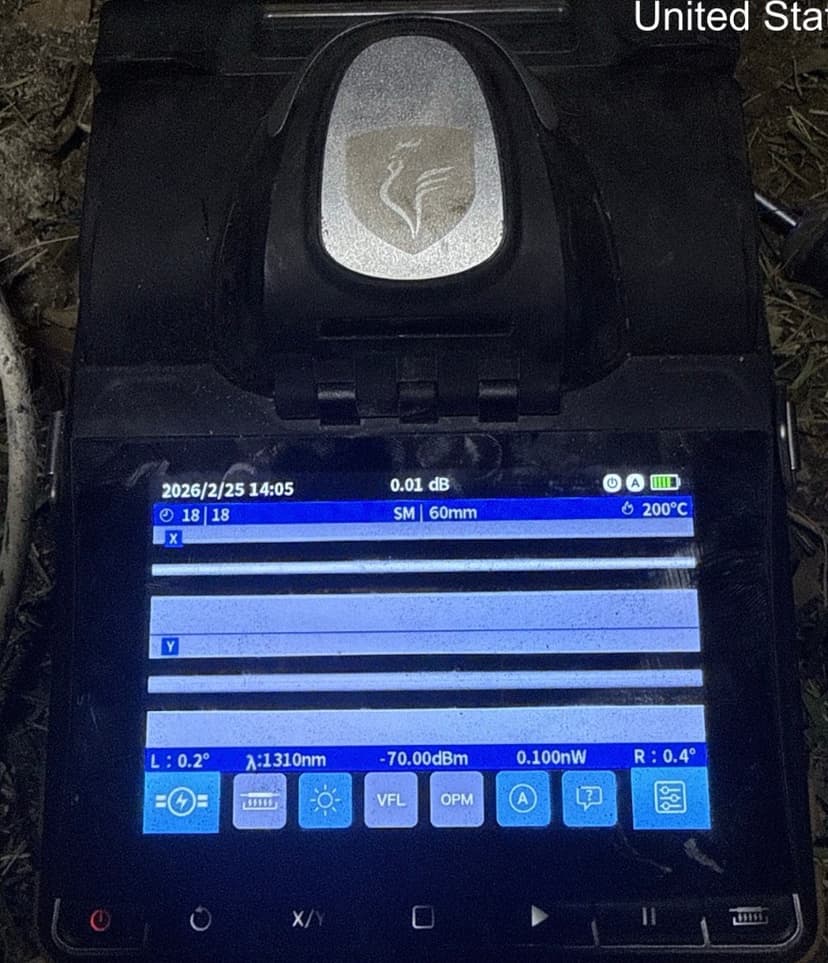
Post-fix splice — 0.01 dB loss
6.2 When to Escalate
Escalate if:
- All connectors are clean, all splices are good, no bends found — but low light persists
- Transmitter power is out of spec (equipment issue, not cable plant)
- Loss budget exceeds power budget due to design limitations (too many splitters, too long a route)
- Multiple customers on the same splitter are experiencing low light simultaneously
Escalation goes to: Network Engineering / NOC with your complete test data, measurements, and the conclusion that the cable plant has been verified clean.
Field Standards
LL thresholds, splice & connector criteria, attenuation tables